Today’s article is all about discovering the ultimate goal of any marketing mix modeling exercise. It’s about what any business is for: maximizing profits and returns on your investments.
For brands selling digitally, especially, one key metric stands out: ROAS, or Return on Ad Spend. This metric is seen as a top KPI because it effectively measures the overall ROI of your marketing efforts.
ROAS simply stands for Return on Ad Spend, and while most in the online sales industry are familiar with it, there are multiple interpretations that can create confusion. That’s why our first chapter dives into exploring these different interpretations and, more importantly, it clarifies the right way to accurately calculate ROAS.
We’ll unpack how ROAS should be used so you can confidently measure and optimize your ad investments. From dispelling myths to aligning on correct calculations, we’ll set the foundation for understanding ROAS in a way that drives better business decisions.
So let’s kick off by looking at some common wats to look at ROAS and how to avoid the pitfalls.
So, to better understand this, let’s imagine you’re a brand selling something like shoes on Shopify. You have your own D2C platform, and you’re trying to figure out how to calculate your return on ad spend or assess the overall effectiveness of your marketing efforts.
Now, typically, if you’re running a digital marketing campaign, you’re probably attending monthly review meetings. One of the main KPIs that pops up for discussion is Return on Ad Spend, or ROAS.
Picture this: you’re in the meeting room, surrounded by folks from the marketing team, finance, and maybe even your business head or the Chief Marketing Officer. Or maybe you are the business head or the CMO yourself. Everyone who has been part of such meetings would agree that these meetings can get confusing frequently when there’s no clear understanding of how to measure ROAS.
Both the “return” and the “spend” parts of ROAS can be a little fuzzy, and that can lead to a lot of back-and-forth in the room. For a productive meeting, it’s crucial that everyone agrees on what KPI or metric to use and has a clear consensus.
Understanding these metrics properly is the first step to getting your marketing strategy on point.
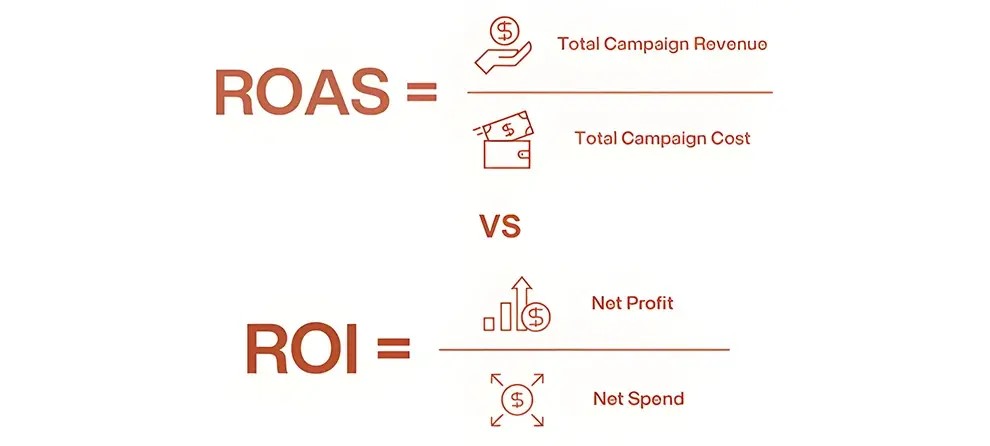
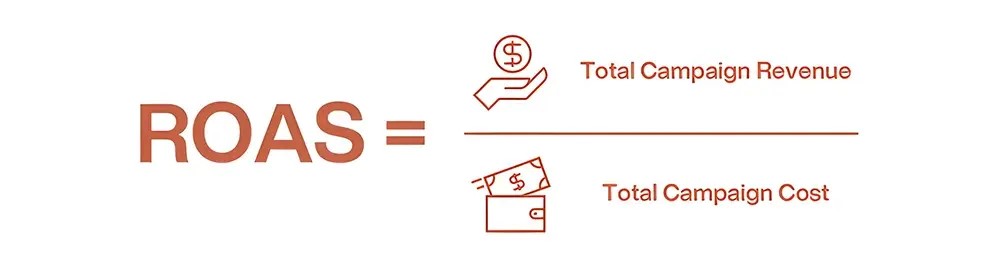
Most commonly ROAS is viewed as the total campaign revenue divided by the campaign cost. But there’s a catch: ROAS often gets mixed up with ROI—Return on Investment—a term that’s similar but quite distinct.
ROI measures your actual profits, factoring in all business expenses, not just your ad spend. This means it considers every cost—from marketing to operations to overheads—giving you the full picture of your business’s profitability by focusing on net profit after all costs.
ROAS, on the other hand, is all about the effectiveness of your ad campaigns. It’s calculated by dividing the revenue generated by a specific campaign by the total cost of that campaign. This metric zeroes in on how efficiently your ad spend translates into revenue, giving you a targeted look at your advertising performance. But remember, it’s not the only lens through which to evaluate your marketing success!
Another common approach to calculating ROAS is by taking the total revenue generated by your brand and dividing it by the total ad spend. For instance, if your shoe brand on Shopify generates $50,000 in revenue for the month and you’ve spent $10,000 on ads, your ROAS would be 5. It’s straightforward, but there are nuances to consider.

For example, One key question is whether you should use gross revenue or net revenue in your calculations. Gross revenue is the total income generated without any deductions—it’s the pure top-line number. Net revenue, however, accounts for deductions like returns, discounts, and commissions.

For example, in the shoe business, returns are common; customers might send products back due to size issues or dissatisfaction. In fashion, return rates can be as high as 30%, while in food and beverages, they might be around 4-5%. These returns significantly impact net revenue.
Promotions and discounts are another factor—brands frequently run sales, which can lower the net revenue. Additionally, if you’re selling on platforms like Amazon or Myntra, you might be paying hefty commissions, which can further reduce net revenue. Commissions for listing products and logistics can range from 20% to 40%, depending on the platform.
So, should you use gross or net revenue for calculating ROAS? Gross revenue is often considered better for measuring the effectiveness of your media spend, as it provides a clearer view of customer behavior directly influenced by your ads. It reflects the total sales generated by your marketing efforts, without the noise of operational deductions.
Tracking net revenue is still important, but using gross revenue for ROAS gives a more accurate picture of how well your ads are driving customer purchases. Remember, the goal of marketing modeling is to gain insights into customer reactions to your marketing efforts, and gross revenue aligns more closely with that goal.
Beyond this, it’s crucial to understand that not all revenue is directly generated by ad spend. Some sales come from direct visits to your Shopify site, organic search results, referrals, or other channels that aren’t directly linked to paid advertising.
With the rise of digital marketing, attribution has become far more precise compared to traditional media. In the past, marketers struggled to connect the dots between a TV ad or print campaign and actual sales, relying on rough estimates and broad assumptions.
Today, digital tools like Google Analytics and Facebook Pixel track every step of a customer’s journey—from clicking an ad to making a purchase. This makes it much easier to directly attribute revenue to specific marketing efforts, providing a clearer picture of which channels and campaigns are driving sales.
These models allow you to see the true impact of your ad spend, ensuring that only revenue directly tied to your campaigns is included in your ROAS calculations. This results in a more accurate and actionable understanding of your ad effectiveness.
Because of this, the best practice for calculating ROAS often involves using only the revenue that can be directly attributed to your ad spend.
A more advanced approach digs deeper—analyzing specific campaigns and linking revenue directly to those campaigns.
This way, you’re only factoring in the costs and returns that are truly connected, giving you a more precise understanding of your ad effectiveness.
And that’s why this campaign specific approach to ROAS can help avoid some pitfalls and ensure your marketing strategy is effective.
But does it really avoid the pitfalls? Well, not entirely. Sure, there are several attribution models out there, and we’ll be diving into them in upcoming lessons. But let’s be real—multi-touch attribution has its own set of issues.
First off, consumers today are more privacy-conscious than ever. With all the new barriers to capturing data—thanks to privacy laws and cookie restrictions—it’s getting harder to track a customer’s journey. Imagine you search for a product on Google and make a purchase. But what if it was actually a Facebook or Instagram ad that first caught your attention? That kind of journey was once tracked by multi-touch attribution models, and they still exist, but they’re not as reliable as they used to be. In fact, with 30-40% of customers blocking cookies, we’re often left in the dark about their interactions.
This lack of data is why there’s growing interest in marketing mix modeling (MMM) to truly understand how different media channels influence purchasing decisions. But even MMM isn’t foolproof, and miscalculations can lead to a lot of frustration, especially when trying to agree on a common understanding of ROAS.
One common mistake in calculating ROAS is assuming that all revenue is directly attributable to ad spend, ignoring other drivers like organic traffic, repeat purchases, and seasonal spikes. More importantly, every brand has some level of base sales that continue regardless of marketing efforts. Ignoring these base sales is a big flaw, and that’s where MMM comes in. It helps establish your base sales so you can accurately measure how much of an increase was generated by your marketing efforts.

Another issue is the complex interaction between different media platforms. Think of the marketing funnel—a customer’s journey often starts with brand awareness (maybe from a Facebook ad) before they actually purchase (perhaps after searching on Google). In today’s world, where we lack data on 30-40% of customer interactions, it’s nearly impossible to model these touchpoints accurately with traditional attribution models. As a result, many brands end up reporting isolated, channel-specific ROAS, which gives a misleading picture of each channel’s impact and can lead to poor business decisions.
That’s why MMM, especially its media mix modeling component, is essential. It helps untangle these complex interactions and provides a more holistic view of how different channels work together to drive sales.
And there’s another often-overlooked issue—lag effects. Brands sometimes report monthly ROAS based on monthly media spends and sales, ignoring the fact that media impacts often take time. Customers don’t always rush to your Shopify store the moment they see an ad. Maybe they see your ad today but don’t feel the need to buy shoes until two months later when their current pair is falling apart. If you ignore this lag, you end up with inaccurate ROAS calculations.
Lag effects can be modeled more accurately with MMM, allowing you to factor in delayed customer responses. This is another reason why understanding ROAS in its full complexity is so important—it’s easy to oversimplify and end up with misleading KPIs.
So, what should you be calculating?
The answer is incremental ROAS, which looks at the increase in sales generated by your marketing efforts over your base sales. By isolating this increment, you can more accurately measure the true impact of your ad spend. This is the most scientifically accurate way to use ROAS for decision-making.
To start, you need to determine your base sales—without that, you can’t understand how much of your sales are truly driven by marketing. Once you have your base sales figured out, you can model the contributions of each media channel. We’ll get into this in more detail in the next module.
But it doesn’t stop there.
You also need to consider other factors like pricing, discounting, promotions, and seasonality—all of which affect your sales. Ignoring these could lead to overestimating the impact of your media or underestimating the impact of other factors. For example, if you raised prices at the same time you launched a killer marketing campaign on Instagram, the campaign might be doing more heavy lifting than you think.
- Determine Base Sales
- Model Contribution of Each Media Channel
- Model Other Factors in Marketing Mix
- Measure Incremental Sales
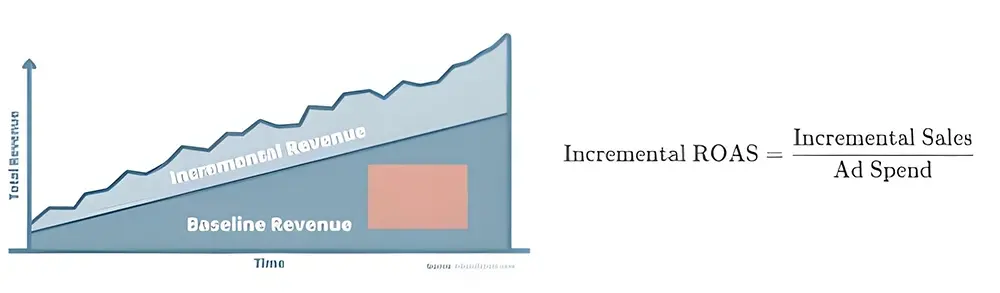
Ultimately, the goal is to measure the total incremental sales generated and use that to calculate incremental ROAS. In today’s exercise, we’ll start by establishing your baseline sales and modeling the incremental sales driven by your ad spend. Then, we’ll calculate the incremental ROAS.
To do this, we’ll dip into some statistics, starting with a simple linear regression model. We’ll keep it basic for now, just looking at overall ad spend and sales. As we progress through the modules, we’ll layer in more complexity until we’ve built a full-fledged marketing mix model.
Let’s dive into a simple example, similar to our case study where you’re selling shoes on your Shopify platform. For now, we’re focusing on total sales of all your shoes and looking at the total ad spend across all media platforms.
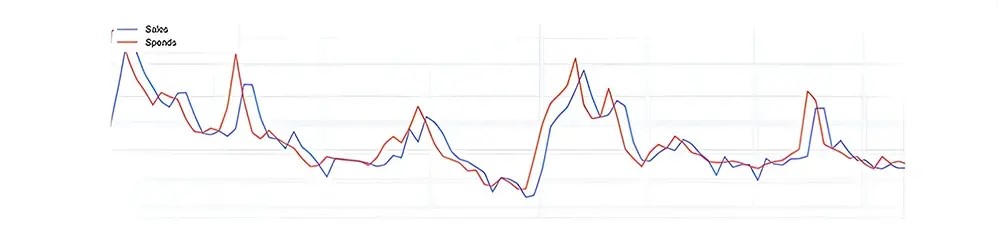
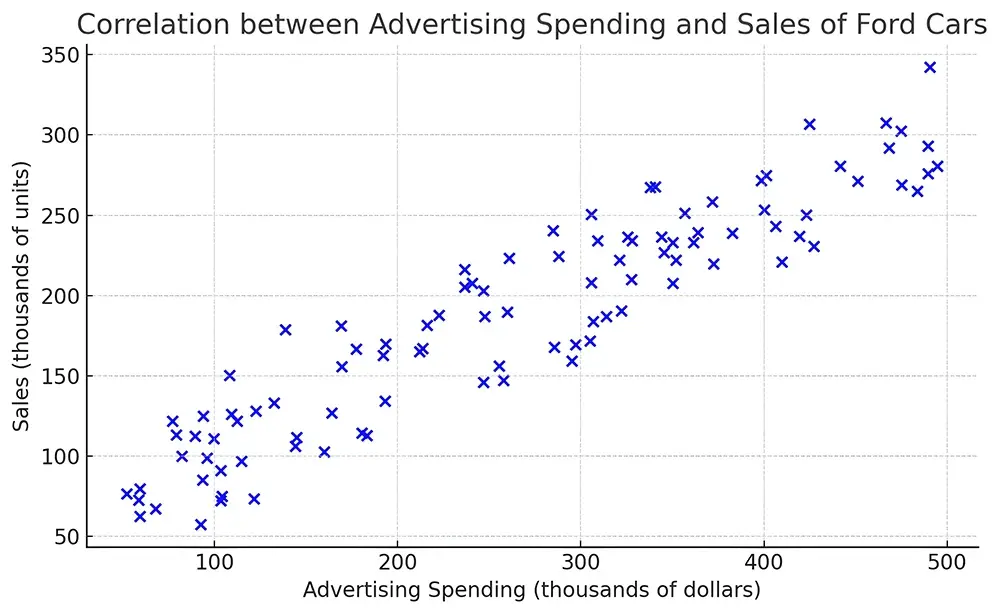
To start modeling this, you’d create a scatter plot. Now, what’s a scatter plot? It’s essentially a graph where you plot advertising spends on the X-axis and the sales you’ve generated—whether in total units sold or total revenue—on the Y-axis. Imagine you’re looking at week-by-week data over the past two years. That gives you 52 weeks per year, times two years—104 data points. Each dot on the scatter plot represents a specific week, showing the relationship between your weekly sales and ad spend.
As you plot these points, you’ll begin to see a pattern emerge. Even just by eyeballing it, you can start to notice a relationship between your advertising spends and your overall sales. In this case, you’ll likely see a positive trend: as your ad spend goes up, your sales tend to go up as well.
The whole point of building a regression model is to quantify this relationship between spends and sales. In general, any regression model helps you understand how an outcome—like your sales—is influenced by one or more independent variables—in this case, your advertising spends. Essentially, you’re trying to model and make sense of how your ad investments are impacting your sales.
So, let’s get started with our basic regression in the next article and see how we can turn those insights into actionable strategies!
No Comments